A dashboard that understands the rhythm of a restaurant
October 2026Meular team6 min read
Every morning, restaurant managers need to know whether yesterday was normal and what deserves attention. At Meular, we worked with an Asian cuisine restaurant in Las Palmas de Gran Canaria to answer those questions using its own till data. The project connects a cloud POS system to a database and a web dashboard. Its value comes from interpreting sales correctly, comparing equivalent periods and turning detailed records into practical decisions about the menu and the running of the restaurant.
From the till to a daily starting point
The starting point was the information the restaurant already generated in its point of sale system: orders, order lines, dining areas and payment methods. An automatic daily extraction transfers these records from the cloud POS to a database. That database supplies a web dashboard, giving managers a consistent basis for reviewing activity without rebuilding the analysis from scratch every morning.
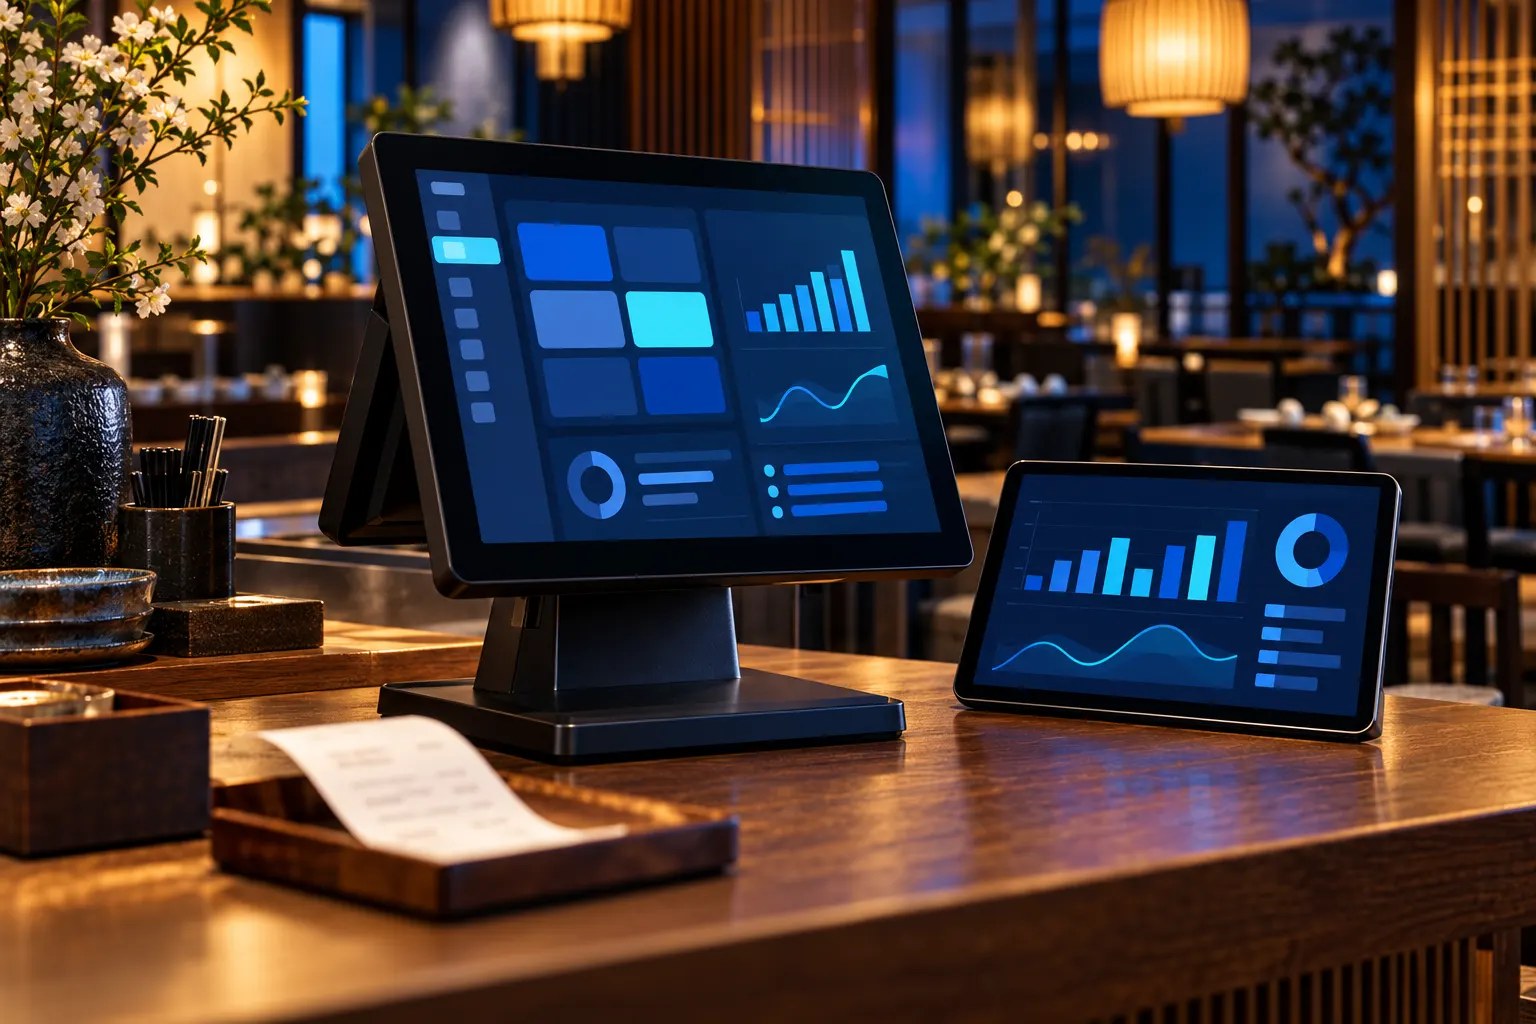
The dashboard has eight screens: Today, Alerts, Sales, Year and comparison, Menu, Basket and channel, Dining area and service, and Till and bank. Each addresses a management question, from how the day went to which items customers buy together or how payments are distributed. Updates are daily: Today is the entry screen's name, but it does not mean that the figures are available in real time.
Till data, on one screen every morning.
Compare Tuesdays with other Tuesdays
A drop against Saturday may be entirely normal when the day under review is a Tuesday. Each day is therefore compared with the normal range for that same day of the week. This reference helps managers distinguish the restaurant's usual rhythm from a change that merits investigation. The useful question is whether yesterday behaved as expected for that particular weekday.
Monthly comparisons require another simple rule: compare the current month with the same month last year, always up to the same date. As an illustrative example, the period from the 1st to the 15th should be compared with the 1st to the 15th, rather than the whole corresponding month. Comparing a partial month with a complete one was the most frequent error encountered and could create an unjustified warning.
A useful dashboard helps you understand whether yesterday was normal and where to focus your attention today.
Four menu categories, four different decisions
Menu engineering combines two dimensions: how often a dish sells and how much margin it generates. The results fall into four categories, Gold, Silver, Bronze and Iron, which help organise decisions. Strong demand alone is not enough: a popular dish may contribute little margin. Equally, a profitable dish should not automatically be dismissed simply because customers are not yet ordering it very often.
Gold dishes deserve visibility and consistent execution. For Silver dishes, review costs, portions and prices to improve their contribution. Bronze dishes call for a closer look at whether their description, position on the menu or staff recommendations are limiting demand. With Iron dishes, review the proposition and consider changes or removal. These categories guide decisions in context; they do not automatically dictate what stays on the menu.
The menu in four categories
Category
What it is
What to do
Gold
Sells frequently and generates a healthy margin.
Give it visibility and maintain consistent execution and availability.
Silver
Sells frequently but generates little margin.
Review costs, portions and pricing while preserving its appeal.
Bronze
Generates a healthy margin but is rarely ordered.
Improve its presentation and test recommendations from the team.
Iron
Is rarely ordered and generates little margin.
Review the proposition and consider reworking or removing it.
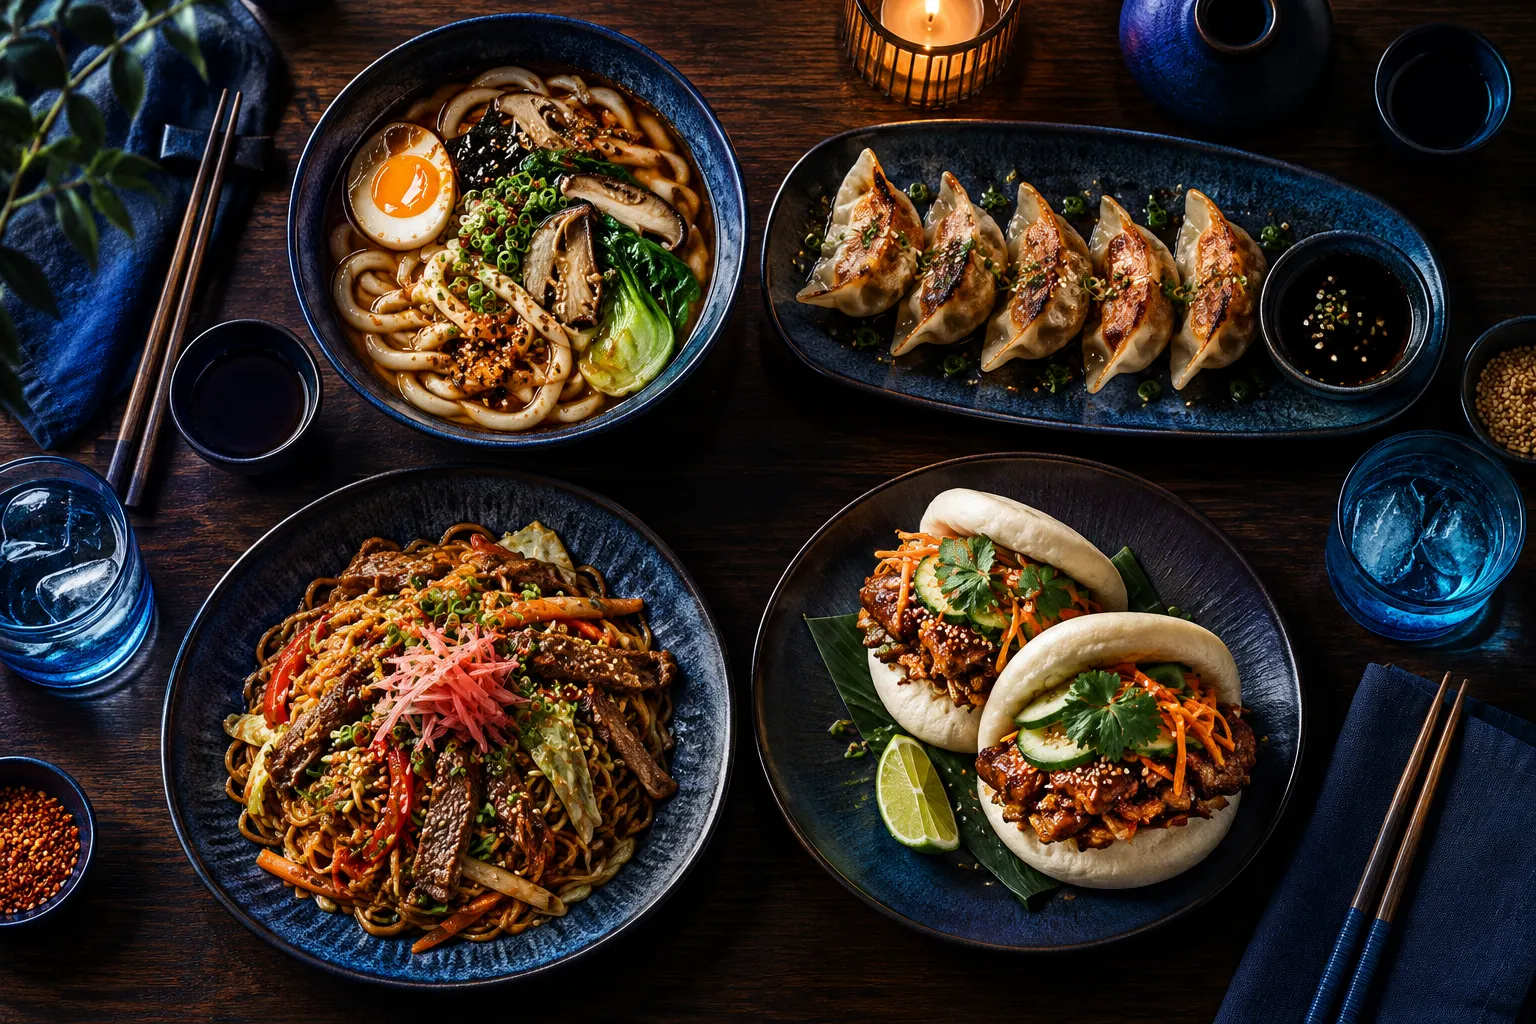
The menu, sorted by what sells and what it earns.
The category explains what a single dish conceals
The project revealed a misleading signal: when a new dish was introduced, another dish in the same menu category fell to less than half its previous unit sales. Expressed as an illustrative percentage, this looked like a 56% decline. Viewed alone, it suggested that the declining dish needed attention. Yet the category as a whole remained steady: customers were switching from one option to another.
This case explains why alerts operate at menu category level. Managers first check whether the group is losing activity, then examine individual dishes to understand which ones are changing. A switch within the menu is therefore not immediately treated as a demand problem. The detail remains useful, but it needs the context of the whole category before it can support a sensible operational decision.
Time zones and adjustments affect the figures
The most revealing technical detail concerned the clock: the POS stores timestamps in UTC. Without conversion to Canary Islands local time, late dinners appeared on the following day and disrupted daily reporting. The review required attention to the time zone before interpreting daily activity. When analysing services that cross midnight, it is also useful to distinguish the calendar date from the restaurant's service day.
Defining actual sales also meant excluding staff consumption and understanding what each record represented. Filtering orders by status without knowing how the POS uses that field can change the result incorrectly. Corrective invoices already arrive with negative amounts: removing them or subtracting them again distorts sales. Before applying a seemingly reasonable filter, check the transaction it represents and its effect on the reported total.
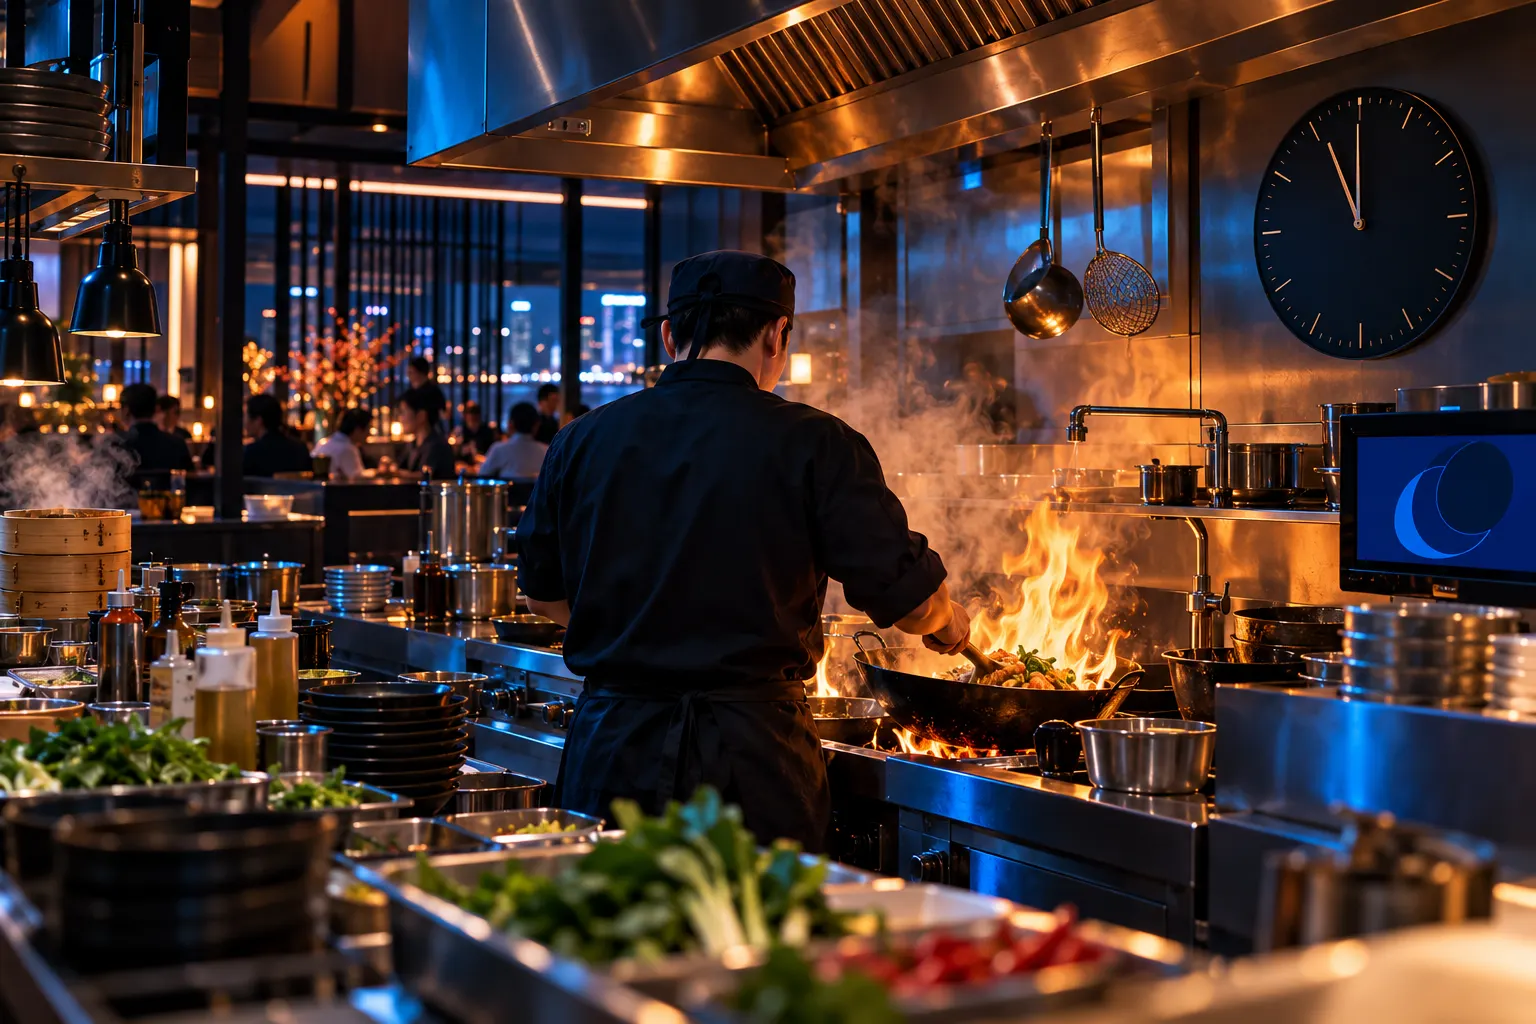
Late dinners: the time-zone detail that skewed the days.
A management routine built around practical questions
The outcome is a concrete routine: management opens one screen each morning and knows whether yesterday was normal, which dishes to promote or review, and where to look next. There is no need to attribute an increase in sales to the project to explain its usefulness. Its contribution is a shared understanding of activity and a clear sequence for investigating the issues that deserve attention.
For another restaurant, the starting point would be to agree what counts as a sale, how each transaction is assigned to a day and which comparisons are fair. It then makes sense to organise menu analysis and alerts around actual decisions. In this case, Meular's work connected the available data to those management questions, keeping the rules behind each indicator visible and understandable.
Frequently asked questions
Does the dashboard show data in real time?
+
In this project, POS extraction is automatic and daily. Management uses the dashboard each morning to review the previous day; it is not presented as a tool for monitoring activity in real time.
Why compare each day with the same weekday?
+
A Tuesday may follow a different pattern from a Saturday. The normal range for matching weekdays offers a more useful reference for identifying deviations than a comparison between days with different trading patterns.
Does a decline in one dish require menu changes?
+
Not necessarily. Check its category first: a new dish may displace another without reducing demand for the group. Then examine the detail and margin before deciding what to do.
How do you avoid errors when calculating sales?
+
Exclude staff consumption, interpret POS statuses correctly and retain the negative sign on corrective invoices. UTC timestamps also need conversion to local time, and comparisons must cover equivalent periods.
Turn your POS data into decisions
Meular, a data, AI, cloud and cybersecurity consultancy in the Canary Islands, helps turn your restaurant's data into useful information for everyday management.